1 Global climate and the greenhouse effect
1.2 What determines the Earth's GMST?
The Sun is the ultimate source of energy for the Earth's climate. A planet such as the Earth will have a stable temperature as long as there is a balance between the rate at which energy comes in from the Sun and the rate at which it is returned to space by the planet. If the two rates fail to match, the planet will either warm up or cool down until a balance is restored. Thus, it is appropriate to begin with a review of this global balancing act. The heart of the matter is that the energy flows to and from space are in the form of radiation – or to be more precise, electromagnetic radiation. You should consult Box 1 (Section 1.1) if you need to refresh your memory about this form of energy transfer.
1.2.1 Heating and cooling the Earth: the overall radiation balance
The Sun emits electromagnetic radiation with a range of wavelengths, but its peak emission is in the visible band – the sunlight that allows us to see. The wavelength of radiation has important climatic implications, as we shall see shortly. For now, we are mainly interested in the overall rate at which energy in the form of solar radiation reaches the Earth.
What is the SI unit for the rate of energy transfer, or ‘power’?
The watt (W), defined as 1 W=1 J s−1 (joule per second).
Radiation streams out of the Sun at the prodigious rate of 3.85 × 1026 W. Located at an average distance from the Sun of some 150 × 106 km, the Earth intercepts only a tiny fraction of this – an amount equivalent to the solar radiation falling on the flat, circular disc depicted in Figure 2. Note that we imagine the disc to be just outside the Earth's atmosphere and aligned at right angles to the Sun's rays: the solar input per unit area (a square metre, say) of this disc is called the solar constant. Measurements from satellite-borne radiation sensors give the solar constant an average value over recent years of 1368 W m−2. Of course, the Earth is a rotating sphere, not a flat disc. As explained in the paragraph below Figure 2, when averaged over the surface of the whole globe, the solar input per unit area at the top of the atmosphere comes down by a factor of four, to 342 W m−2. For simplicity, we shall refer to this globally averaged value as ‘100 units’, though you should remember that these are units of ‘energy per unit time per unit area’.
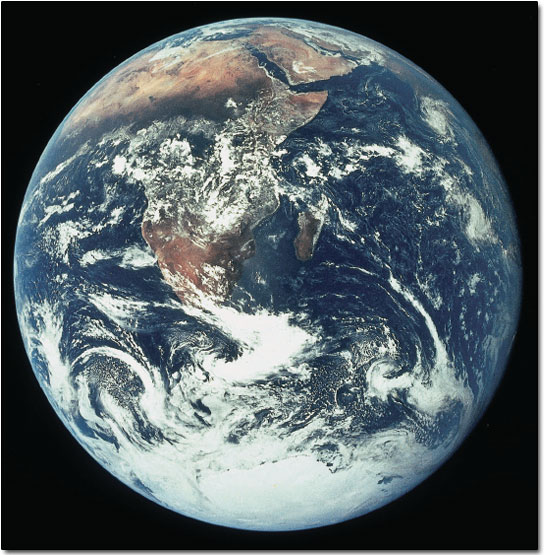
Not all of the incoming solar radiation is available to heat the Earth: some of it is reflected directly back to space. The proportion of incident solar radiation that is reflected by a given surface is called the albedo. Now have a look at Figure 3. This is an image of the Earth from space formed from reflected sunlight (solar radiation at visible wavelengths). Clouds and the ice-covered mass of Antarctica (at the bottom of the image) appear bright because they reflect strongly; i.e. they have a high albedo – up to 90% in the case of fresh snow and sea-ice. By contrast, the oceans have a low albedo (typically less than 5%) and appear dark in this image. In general, most land surfaces have moderate albedo, with values ranging from 10–20% for forests to around 35% for grasslands and deserts.
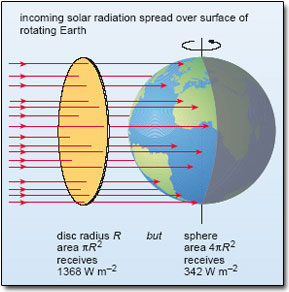
Figure 2: The Earth intercepts an amount of solar radiation equivalent to that falling on a disc with the same radius (R ) as the Earth, facing the Sun: this comes to (1368 × πR2 ) W, where πR2 is the area of the disc (in m2). However, the Earth is spherical , so the area presented to the incoming solar radiation by the rotating Earth (over a period of 24 hours or more) is 4πR 2; i.e. four times as great. Thus, the solar input per unit area averaged over the surface area of the whole Earth is a quarter of the solar constant; i.e. 1368 Wm−2/4=342 Wm−2.
Evidently, the albedo can vary markedly around the world, depending on the cloud cover and surface characteristics. The planetary albedo is the combined figure for the Earth as a whole: on average, it has a measured value of 31% (31 units). The remainder (69 units) is absorbed by the atmosphere and materials at the Earth's surface (the oceans, soils, vegetation and so on).
What is the rate per unit area at which solar energy is absorbed by the Earth's atmosphere and surface?
69 units is 69% of 342 W m−2 or (342 W m−2) × (69/100)=236 W m−2.
Suppose now that the Earth's atmosphere is stripped away, but the planetary albedo is unchanged. (This may strike you as a curious proposition, but it will help to expose just how important the atmosphere really is.) The energy flows at the surface of this ‘airless’ world are shown in Figure 4. To the left of the figure, a nominal 100 units of solar radiation reach the planet; 31 units are reflected away and all of the remaining 69 units are absorbed by the surface.
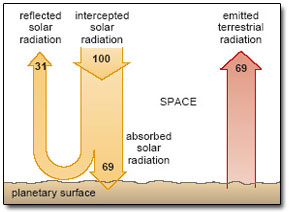
Figure 4: The steady-state balance between incoming and reflected solar radiation (orange arrows) and outgoing terrestrial radiation (reddish arrow) for an Earth-like planet without an atmosphere. 100 units represent the globally averaged rate per unit area at which solar radiation reaches the planet; i.e. 342 W m−2.
By itself, what would be the effect of this continual input of solar energy?
The surface would warm up; indeed, it would get progressively hotter and hotter.
Fortunately, there is a compensating cooling effect. Like the Sun, all objects (you and I included) emit electromagnetic radiation. Further, they do so at a rate that depends on the temperature of the object: the hotter an object becomes, the higher its radiative power – the rate at which it emits radiation. For our planet, a steady or equilibrium temperature is maintained by a dynamic balance: the rate at which solar energy is absorbed (the 69 units to the left in Figure 4) must be balanced by the rate at which the planet loses energy to space as emitted radiation (the 69 units to the right in Figure 4). Note that this emitted radiation originates with the ‘jostling about’ of atoms within the surface; it is not the same thing as the reflected solar radiation, which merely ‘bounces off’ the surface. To emphasise the distinction, we shall refer to the radiation emitted by the planet as terrestrial radiation.
Expressed in quantitative terms, the relationship between temperature and radiative power is the basis for a well-established law of physics. The appropriate calculations tell us that, for an Earth-like planet to emit radiation to space at a steady rate of 236 W m−2 (the 69 units depicted in Figure 4), it should have an equilibrium temperature of -19 °C.
This equilibrium temperature is known as the effective radiating temperature and, were it not for the atmosphere, this would also be the Earth's global mean surface temperature. Conditions would certainly be inimical to life as we know it. But how does the atmosphere perform the vital trick of keeping the GMST at a more temperate 15 °C (? The answer is bound up with an important difference between ‘solar’ and ‘terrestrial’ radiation – one that again depends on the temperature of the source.
Question 1
Heated in an ordinary fire, a metal poker glows ‘red-hot’; if heated to a higher temperature (in an oxy-acetylene flame, say), it would glow ‘white-hot’. Generalising from this example, does the average wavelength of emitted radiation increase or decrease as the temperature of the emitting body rises? Include your reasoning.
Answer
White light contains all visible wavelengths (Box 1), whereas red light is at the long wavelength end of the visible band (Figure 1). ‘White-hot’ objects therefore emit light of shorter average wavelength than cooler ‘red-hot’ ones. Generalising, as the temperature of an object rises, so the average wavelength of the radiation it emits will decrease.
The trend you identified in Question 1 is evident in Figure 5. Here, the curves record the distribution, or spectrum, of wavelengths emitted by the Sun (with an average surface temperature of some 5500 °C) and the Earth (with a GMST of 15 °C). The plots are schematic, in the sense that the vertical scale is not defined, but each shows how the radiative power is apportioned among the range of wavelengths emitted.
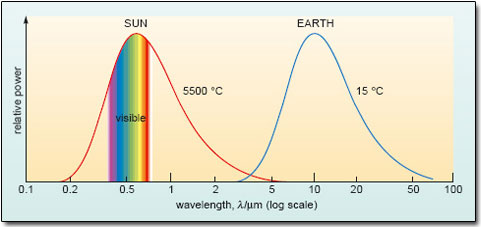
Figure 5: Wavelength spectrum of solar radiation (red) and terrestrial radiation (blue). The solar spectrum has been simplified and is for the solar radiation intercepted by the Earth (as in Figure 2), not the total power emitted by the Sun. Note again that the wavelength scale is logarithmic.
With reference to Figure 5, is it reasonable to use ‘shortwave’ and ‘longwave’ as a shorthand for incoming solar radiation and outgoing terrestrial radiation, respectively?
Yes. The two curves in Figure 5 barely overlap: solar radiation peaks in the visible band, although there are contributions at both shorter wavelengths (in the ultraviolet, uv) and longer wavelengths (in a region often called the ‘near’ infrared). By contrast, radiation emitted at cooler terrestrial temperatures lies entirely at longer infrared (ir) wavelengths.
This pattern is important because the atmosphere is relatively transparent to incoming shortwave radiation, but not to outgoing longwave radiation. And that has a profound effect on the actual energy balance at the Earth's surface.
1.2.2 Bringing in the atmosphere: the natural greenhouse effect
As a dam built across a river causes a local deepening of the stream, so our atmosphere, thrown as a barrier across the terrestrial rays, produces a local heightening of the temperature at the Earth's surface.
Thus, writing in 1862, John Tyndall (Figure 6) described the key to our modern understanding of why the Earth's surface is so much warmer than the effective radiating temperature. Tyndall's careful experimental work had established what others only suspected: expressed in modern scientific terms, certain atmospheric gases absorb infrared radiation with wavelengths in the range spanned by outgoing terrestrial radiation (about 4 to 100 μm; Figure 5). These are the greenhouse gases. Tyndall identified water vapour and CO2, but the list of natural greenhouse gases (naturally present in the atmosphere long before human activities began to make their mark) also includes methane (CH4), nitrous oxide (N2O) and ozone (O3). The main mechanism by which these gases absorb infrared radiation is through the vibrations of their molecules. We shall not pursue the scientific principles that underlie this mechanism in any detail, but the key points we shall need are summarised in Box 2.
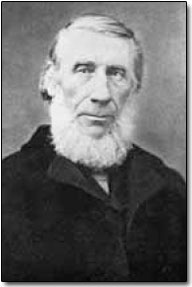
Like many Victorian scientists, Tyndall was interested in a great many questions – contributing to such diverse areas as heat transfer, glacier motion and scattering of light in the atmosphere, where he is honoured for his explanation of why the sky is blue (the Tyndall effect). He was a keen alpinist, and attracted by one of the great riddles of his day: if vast sheets of ice had once covered all of northern Europe (hotly debated at the time), how could climate have changed so radically? One then-current hypothesis was a change in atmospheric composition, and it was this possibility that led to Tyndall's pioneering work on the physics of the greenhouse effect. He was also a committed communicator; during his time at the Royal Institution, he earned great renown for presenting science to the public. So it is fitting that one of the climate change research institutes in the UK, with a particular focus on an interdisciplinary approach and communication with the public, local authorities, business, etc., is named after him – the Tyndall Centre in Norwich.
Box 2 ‘Exciting’ molecular vibrations
- The chemical bonds that hold a molecule together are like springs and, like them, they can stretch and flex, making the molecule vibrate. Molecular vibrations always have a characteristic frequency. If a molecule absorbs radiation of a matching frequency – and hence with a characteristic wavelength (see Box 1) – the energy it gains makes it vibrate more vigorously. The frequencies of molecular vibrations invariably correspond to wavelengths in the infrared part of the spectrum.
- To be ‘infrared active’ (i.e. to absorb infrared radiation through changes in the way it vibrates), a molecule must contain more than two atoms or, if there are just two atoms, these are of different elements. More complex molecules, such as the greenhouse gases, can vibrate in several ways, each with its own characteristic frequency. So they can absorb a range of wavelengths in the infrared.
- Once ‘excited’ by absorbing infrared radiation, a greenhouse gas molecule can lose energy again by re-emitting radiation of the same wavelength. Alternatively, it can pass energy on to other molecules in the air by bumping into them: the net effect is to increase the total ‘energy content’ of the air, warming it up.
Taken together, the natural greenhouse gases absorb infrared wavelengths throughout most of the terrestrial range; there is only one region, between 8 and 13 μm, where absorption is weak. Known as the ‘atmospheric window’, this allows some of the longwave radiation from the surface to escape directly to space, but most of it is intercepted by the atmosphere. That changes the simple picture in Figure 4 substantially. A better representation is shown in Figure 7. Now most of the longwave radiation from the surface is effectively ‘trapped’ and recycled by the atmosphere, being repeatedly absorbed and re-emitted in all directions by the greenhouse gases. This warms the atmosphere. Some of the re-emitted radiation ultimately goes out to space, maintaining an overall radiation balance at the top of the atmosphere, as shown in Figure 7. This prevents the whole Earth-atmosphere system from heating up without limit. The crucial difference is that much of the re-emitted radiation goes back down and is absorbed by the surface. It is this additional energy input – over and above the absorbed solar radiation – that keeps the Earth's GMST over 30 °C warmer than it otherwise would be.
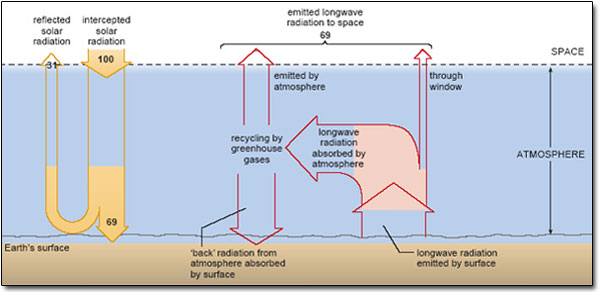
Figure 7: Schematic representation of the globally averaged radiation balance for an Earth-like planet with an atmosphere that absorbs and re-emits (both downward and upward) longwave radiation from the surface (reddish arrows).
As in Figure 4, Figure 7 shows that 69 units of solar radiation are absorbed by the planet and 69 units of longwave radiation go back out to space. However, this overall radiation balance is now at the top of the atmosphere, not at the surface, which receives an extra input of energy through the ‘back radiation’ from the atmosphere.
The surface warming attributed to the back radiation from the atmosphere is called the greenhouse effect.
The contribution each of the greenhouse gases makes to the total effect depends on two main factors: how efficient it is at absorbing outgoing longwave radiation, and its atmospheric concentration. The striking thing is that most of these gases are only minor atmospheric constituents, as shown by the information collected in Table 1. Here, concentrations are given as ‘mixing ratios’ – the measure of atmospheric composition that has become familiar to policy makers and other stakeholders in the climate change debate (Figure 8). The term is explained in Box 3.

Figure 8: According to the 500 PPM company, ‘Our name is our mission: 500 PPM means 500 parts per million – a critical value for climate protection, because it describes the point at which the concentrations of greenhouse gases in the atmosphere should be stabilized’.
Box 3 Mixing ratios
Strictly, the mixing ratio (by volume) tells us about the ‘fractional abundance’ or proportion of a given atmospheric gas, although you will often find it referred to as the ‘atmospheric concentration’ (and we shall follow this practice). Taking oxygen (O2) as an example, the formal definition is as follows:

where N total is the total number of molecules in a given volume of air (a cubic metre, say) and N(O2) is the number of molecules of oxygen in the same volume of air. Expressing the fraction in decimal form or as a percentage (by multiplying by 100) is fine for the major atmospheric constituents (see the entries in Table 1), but it becomes unwieldy for minor constituents like the greenhouse gases. In this case, values are usually recorded as ppm (parts per million, 106) or as ppb (parts per billion, 109) – or even as ppt (parts per trillion, 1012) for the least abundant species.
In Table 1, the mixing ratio of CO2 is given as 368 ppm. Express this value as a number (in scientific notation), and then as a percentage.
A value of 368 ppm means that in every million molecules of air, 368 will, on average, be molecules of CO2. So 368 ppm is equivalent to 368/106=368 × 10−6=3.68 × 10⁻⁴ (in scientific notation). Multiplying by 100, this becomes 3.68 × 10⁻²% or 0.0368%.
Now express the mixing ratio of CO2 in ppb.
If there are 368 molecules of CO2 per million in total, there would be 368 000 per billion, so the answer is 368 000 ppb.
Thus, 1 ppm=103 ppb, and similarly 1 ppb=103 ppt.
Table 1: Recent (1998) average mixing ratios of some of the gases in (absolutely) dry air in the lower atmosphere – the region up to about 10 km, known as the troposphere (see Section 1.2.1).
| Gas (and formula) | Mixing ratio |
| major constituents | |
| nitrogen (N2) | 0.78 |
| oxygen (O2) | 0.21 |
| argon (Ar) | 0.0093 |
| trace gases | |
| carbon dioxide (CO2) | 368 ppm |
| methane (CH4) | 1745 ppb |
| nitrous oxide (N2O) | 314 ppb |
| ozone (O2) | 10–100 ppb |
Given the information in Table 1, how would you describe the bulk composition of the lower atmosphere?
99% is nitrogen and oxygen (roughly in a 4 : 1 ratio), and most of the rest (0.93%) is argon.
Is any one of these major components a greenhouse gas?
No. The chemically inert noble gas argon exists as individual atoms; nitrogen and oxygen molecules each consist of two atoms of the same element. None of them fulfils the criterion for being infrared-active (Box 2).
Note that the mixing ratios in Table 1 are for dry air. The contribution from water vapour is not included because the amount in the air is highly variable – from practically none at all up to about 4% (by volume). Part of the explanation is that air can ‘hold’ only a certain amount of water vapour: it has a ‘saturation’ limit, which depends mainly on temperature. The variable humidity of the air (a measure of its water vapour content) is part of our everyday experience: it affects the ability of sweat to evaporate, for example, and the drying of clothes on the line.
Averaged over time and around the globe, water vapour represents about 0.5% of the total atmospheric gas. This relatively high abundance makes water vapour the single most important natural greenhouse gas: it contributes about 60% of the surface warming attributed to the natural greenhouse effect. Carbon dioxide, the second most abundant, contributes a further 25% or so; most of the rest is due to the other three trace gases in Table 1, which have much lower atmospheric concentrations. (One further contribution is noted in Section 1.3.3.)
The fact that the Earth is not a frozen and lifeless rock shows that the natural greenhouse effect is not a ‘bad thing'; indeed, it is a ‘good thing'! It is the extra warming produced by an enhanced or amplified greenhouse effect, due to an increase in the atmospheric concentration of CO2 (and indeed other greenhouse gases), that lies at the heart of current concerns. We shall sometimes refer to this as an increase in the atmospheric ‘burden’ of CO2 (or of greenhouse gases in general), since an increase in concentration necessarily implies an increase in the total amount (or number of molecules) of the gas in the atmosphere.
Question 2
Analogies are a useful aid to understanding, and can be a powerful means of communicating scientific ideas to a lay audience. However, they can be misleading. Look back at the quote from John Tyndall at the beginning of Section 1.2.2. In what way is the analogy used there a misleading one? Explain your reservations, making reference to the mechanism that actually creates the Earth's greenhouse effect.
Answer
The basic problem is the notion of a ‘barrier across the terrestrial rays’. This could suggest that the atmosphere somehow ‘reflects’ back outgoing radiation (an error that sometimes appears in newspaper accounts to this day) and/or that none of it ever goes out to space – in which case the planet would simply heat up without limit! In reality, some of the longwave radiation from the surface escapes directly to space (at wavelengths in the ‘atmospheric window’). The rest is absorbed and re-emitted (up and down) by greenhouse gases in the atmosphere. Back radiation from the atmosphere keeps the surface warmer than it otherwise would be (the natural greenhouse effect). But some of the re-emitted radiation ultimately goes out to space, maintaining an overall radiation balance at the top of the atmosphere.