6 Design and innovation 3: the Brompton folding bicycle
6.5 The structural heart of the machine
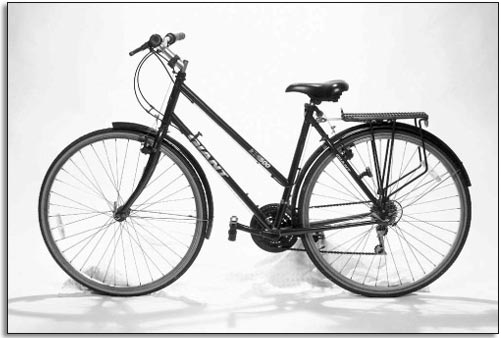
A bicycle consists essentially of a horizontal beam, to which is attached the wheels and a seat post. It is this beam which, structurally, is the most important part of the bicycle. There are forces acting on this beam when a cyclist simply sits on the machine, and they can be particularly large when the cyclist stands on the pedals going uphill, for example. This beam must provide stiffness for the bicycle: a wobbly bicycle isn't much use because the rider wants the downward force on a pedal to result in work that propels the bicycle forward, not into twisting and bending of the structure. A wobbly frame would also feel unstable to the rider. As has already been noted, the Brompton uses a low horizontal beam. Many bicycles use a high beam, with diagonal posts to join this beam to the pedals etc., in an ‘A’-shape (see Figure 50). Ladies’ bicycles use a double diagonal frame, to reduce the difficulty in mounting the bicycle whilst wearing a skirt (Figure 51).
So what is required is a stiff structure that is as light as possible. These two requirements conflict, as reducing weight means less material, which in turn will reduce stiffness. However, it is possible to use the mass available efficiently or inefficiently. Also, we have this business of choice of materials: aluminium, steel, or something more exotic. Figure 52 shows a carbon-fibre composite bicycle. This material has a good stiffness with a low density (so low weight), and in addition the frame is designed to be particularly aerodynamically efficient. A bicycle similar to this, the Lotus Sport bike, was ridden by Chris Boardman when he shaved six seconds off the 4000 metres Individual Pursuit world record at the Olympic Games in Barcelona in 1992.

A racing bicycle like that in Figure 52 is built regardless of cost and the suitability of the design for mass production. In our earlier terminology, it occupies a different design space from the folding bicycle, primarily because of the difference in function: to win races, rather than be portable and affordable. Certainly such a bicycle has no requirement to be foldable. The frame of the Lotus Sport pursuit bicycle used by Chris Boardman was moulded from woven sheets of aligned carbon fibre, layered in a mould with epoxy resin, which was then cured. It weighed 8.5 kg. Although the resulting composite has an excellent stiffness-to-weight ratio, weight is relatively unimportant in a pursuit race because only the first 125 m involve acceleration. The rest of the race takes place at a more or less constant speed – as fast as possible. So, it is aerodynamic drag, which accounts for 96 per cent of the total resistance to motion, that is the predominant design parameter for a pursuit bicycle. About one-third of the total drag is due to the bicycle.
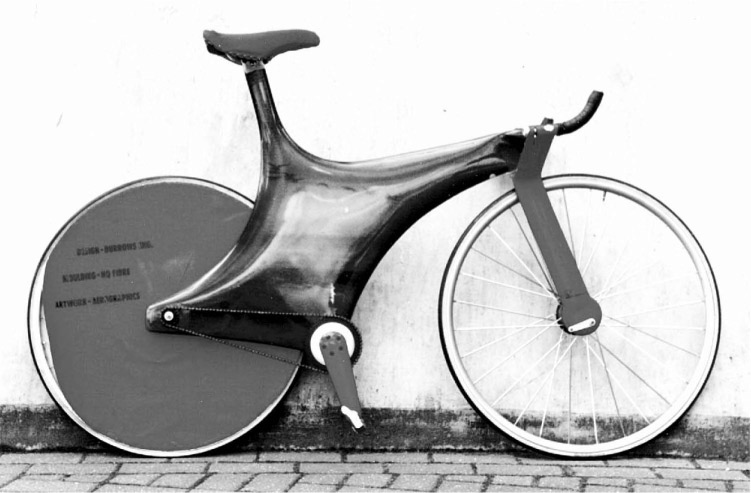
Figure 52: Windcheetah monocoque racing bicycle with carbon-fibre frame. This bicycle was designed by Mike Burrows
However, the main criterion for the Brompton is foldability, with weight coming an important second; and aerodynamics are not important at all. A decent ordinary bicycle weighs about 12 kg and is relatively easy to lift and lug about over short distances. Wheels, gears and handlebars need to be mounted on the bicycle; they are available in aluminium and are extraordinarily light because the designs are mature and optimised.
To make a judgement about materials and their use independently of the complexity of a folding bicycle we need to investigate some basic concepts relating to stiffness. As noted earlier, the main structural member of the bicycle is a deep beam onto which the fork, handlebars, seat pillar and chainwheel are attached.
Activity 1 Investigating stiffness
Try to find two rulers of similar sizes and thicknesses made from different materials. Wood and plastic will do fine; failing that, a plastic and a steel knife or fork, or something similar. I shall assume you have a wooden and a plastic ruler to hand, that they are the same length and have about the same cross-sectional dimensions. The same dimensions are required because you are going to look at differences between materials; if the dimensions change as well then it becomes more difficult to see why any change is occurring.
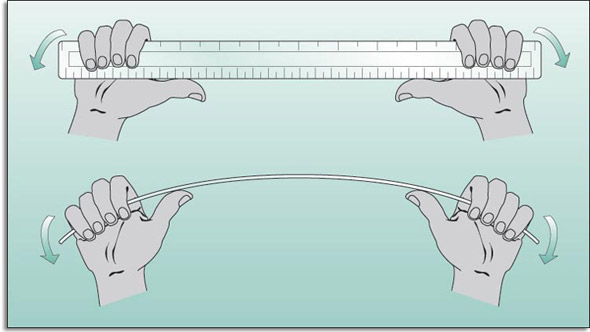
Bend one of the rulers about both cross-sectional axes. You will find it very easy to bend one way, but not the other. It is hardest when there is more material in the direction along which you are applying the bending force (Figure 53). From this you can observe that stiffness depends on geometry.
Exercise 8
How would the ruler behave if it had a square cross-section?
Answer
If the ruler had a square cross-section, it would have the same stiffness regardless of which side was chosen to bend it: the distance would be the same in both cases.
SAQ 15
Now bend both rulers about the easy way. Which material is the stiffer?
Answer
You will find that the wooden ruler is stiffer than the plastic ruler. (If you are using a metal ruler, you will find it is not very stiff, but you should notice that it is also much thinner than a wooden or plastic ruler.) From this you can observe that stiffness depends on materials and that wood is stiffer than plastic. You would also find that wood is stiffer than plastic if you were sensitive enough to feel the deflection when pulling the rulers apart. There is another general observation that can be made from this experiment; it is that tension is much better resisted by a structural member than is bending. Try breaking a matchstick by pulling it apart.
I can now show you these ideas formalised. Figure 54 shows the result of pulling on bars made from different materials, each with the same cross-section. Testing of materials is often performed by using tension forces rather than bending, as it makes for a simpler experiment. Bending induces both tension and compression, which can be complex, particularly as some materials show different behaviour under compression than tension.
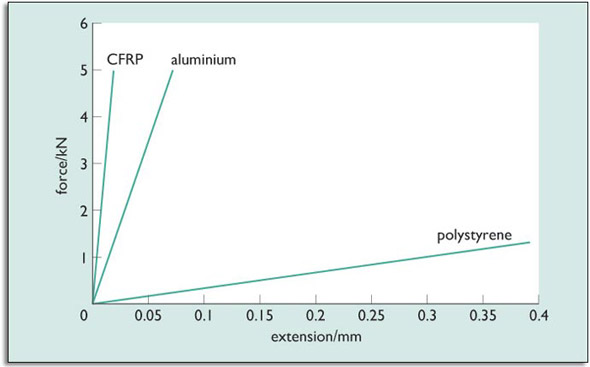
On the graph in Figure 54, the vertical axis is load and the horizontal axis is extension, so the steeper the slope the stiffer the material: there is less deflection for a given load if the material is stiffer. I have been exact in specifying the materials here because different plastics have different stiffnesses, although all are low compared to metals and ceramics.
This is not really a very good experiment. Because the cross-sections are all the same in this case, it is a valid way to compare materials. But the slope of a graph is not a measure of the stiffness of the materials, rather it is a measure of the stiffness of a bar of that size made from that particular material. A bar of twice the cross-section would be twice as stiff.
A designer can alter size as well as material to produce a required stiffness, but to make a general comparison of materials I have to show you how to remove the effect of the cross-section, and indeed the length of a particular bar.
First I shall deal with the cross-section. See Materials and stress.
My goal is to compare materials independently of their size or shape. Although a thicker rope will bear a higher load than a thinner one of the same material, it will not bear a higher stress before breaking. In fact thick and thin ropes, for example, if they are made of the same material and in the same way, will break at the same stress. So here is one geometry-free measure of a material. The maximum stress a material can withstand is the same irrespective of the shape or size of the sample into which the material is shaped.
A bar stretches under load, and you have seen that differently sized bars made of the same material will stretch by different amounts when subjected to the same load. Again, we want a way of comparing stretches that does not depend on the shapes of the samples we are using. Strain explains how this is done.
Materials and stress
Strength is an important mechanical property of any material. It is related to how much force can be applied to the material before it fails. Failure generally means fracture: the material breaks into two or more pieces. There are other types of failure, though, such as when a sample is seriously deformed even though it has not actually broken into pieces. Another type of failure is when a sample is degraded so that it can no longer do its job.
Strength is a materials property, like its Young's modulus. You cannot change the strength of a material by cutting it into a different shape, for example. You might make it easier to break, but this is not because of a change in the material.
You have already come across force. Whenever you stand on floorboards you are applying a force to them. The loading in that case is relatively complex because of the bending, so let's take a simpler example: a rope used to haul a load.
Given a choice between a thick grade of rope and a thinner grade made of the same material and in the same way, which would you go for if you have to haul some heavy loads?
I expect you would choose the thicker rope. The reason you might give would be that the thicker rope ‘looks stronger’. The actual measurable difference is that it can carry a greater force before breaking. Why is this?
Clearly the size of the rope does have a critical bearing on whether or not it will break when it is loaded. A smaller rope can't carry as much force. What we find is that the area of rope which is carrying the force is what is important. Twice as much area of material can carry twice as much force.
The force and the area together are used to define what is called the stress in the material. The stress is found by dividing the force by the area. It is the stress which controls whether a material will fail. The thick rope will fail at the same stress as the thin rope, even though the force required to attain that stress is much higher in the first case.
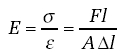
We use the Greek letter (pronounced ‘sigma’) to represent stress. F is the force and A is the area over which the force is acting.
Mathematically, we write the definition of stress as:
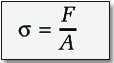
The unit of stress will be the units of force divided by the units of area, that is newtons (N) divided by metres squared (m2). The unit is therefore newtons per metre squared, N/m2or N m−2. (The unit of 1 N m−2is sometimes called the pascal, but we will not use this terminology in this course.)
This brings us to a definition for strength. The strength of a material is the maximum stress that the material can withstand before it fails. As stress varies depending on the area, a smaller piece of material will fail under a smaller force. However, the stress to cause failure should always be the same for a given material.
SAQ 16
Two ropes have diameters of 5 mm and 25 mm. What is the stress in each rope if the force applied is 500 N?
Remember: the area which is important is that which the force is transmitted through, which is the cross-sectional area of the rope. This is the circular area you see if you cut a section across (at a right-angle to) the length of the rope and look end-on at the revealed surface.
Answer
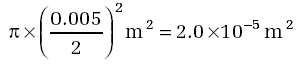
The area of a circle is πr 2, where r is the radius (equal to half the diameter) of the rope. So for the 5 mm diameter rope the cross-sectional area is:
For the 25 mm diameter rope, the area is:
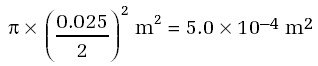
The cross-sectional area of the 25 mm diameter rope is 25 times larger than that of the 5 mm diameter rope. Although the diameter (and so the radius) is only five times larger, because the area depends on the square of the radius, it is larger by 5 × 5=25 times.
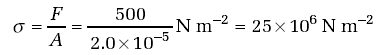
The stress is given by:

So for the 5 mm diameter rope, the stress is:
And for the 25 mm diameter rope, the stress is:
Because the area of the 25 mm diameter rope is 25 times that of the 5 mm diameter rope, the stress is correspondingly 25 times smaller. Hence the larger rope can carry a force 25 times greater than the smaller rope before the strength of the rope is exceeded and the rope fails.
Strain
If we apply a tensile force to a material, it will extend in response. This extension is called strain, and is usually barely perceptible, unless you are pulling something like a rubber band.
There is an analogy here with stress. Stress allows us to separate the materials property – its intrinsic strength – from the effect of the size of the sample, which also has a bearing on how big a load the sample can carry.
Differently sized samples of the same material will fail at different forces, even though the material has an intrinsic strength that is common to all the components. Similarly, strain allows us to quantify the material's response to loading, independently of the size of the sample used.
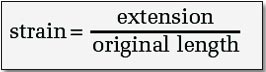
Strain is defined as the extension of the sample divided by its original length.
or
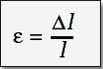
Strain is represented by the Greek letter ε, called ‘epsilon’, and the length of the sample by the letter l. The Δ symbol (more Greek: this is the capital letter ‘delta’) is a shorthand way of saying ‘the change in’. So Δ l means ‘the change in l’. (Δ l is said by running the names of the letters together: ‘delta el’.) Strain is a measure of the elongation of a material, with the change expressed relative to the original size of the sample rather than in units of length.
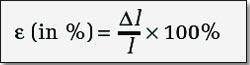
In practice, values of strain are usually quite small, and for this reason they are often expressed as percentages. It's easier to say that ‘the strain is 0.1 per cent’ than ‘the strain is 0.001’. To calculate strain directly in percentage,
The greater the initial length of a sample, the more it will extend when subjected to a stress. However, whatever the sample's initial length, for a given stress, the strain will be the same. That is, a particular value of stress always results in the same strain, for a given material. This is what makes stress a useful concept.
SAQ 17
Calculate the strains, both in absolute terms and as a percentage for the following two examples:
- A 10 centimetre bar which is extended by 1 centimetre.
- A 100 centimetre bar which is extended by 1 centimetre.
Answer
-
For the 10 centimetre bar which is extended by 1 centimetre,
 As a percentage:
-
For the 100 centimetre bar which is extended by 1 centimetre,
 As a percentage:
Note that the elongation is the same in both cases, but the strain is different because the bars were of different lengths.
Exercise 9
What are the units of strain?
Answer
Since strain is extension (a length, measured in metres) divided by the original length (also a length, measured in metres), it has no units. The units cancel when one is divided by the other.
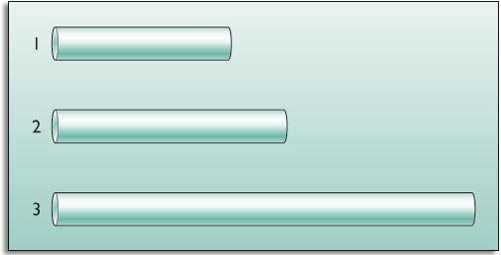
Exercise 10
Figure 55 shows three samples of different lengths, all of which are made from the same material. All the samples have the same cross-sectional area (that is, a given applied force will generate the same stress in each sample).
- Which strip will extend most when the same force is applied to each sample?
- Does the strain vary between the different samples?
Answer
- The longest strip will extend the most, because larger extensions are generated in longer samples, for a given applied stress. Thus the shortest sample will extend least.
- The strain is the same in each strip, even though the extension is different. The stress is the same in each sample, so this will produce the same strain, as the same material is used for each.
We now have two measures, stress and strain, which allow us to compare materials independently of the size and shape of any sample we use for testing.
Plotting a graph with stress on the vertical axis and strain on the horizontal axis (Figure 56) produces a graph that is similar to Figure 54, but generic. That is, the information in the graph is entirely characteristic of the materials; it is independent of the size and shape of the sample used.
The slope of a material's stress–strain graph gives the stiffness of a material. This is called its Young's modulus, and is represented by the letter E.
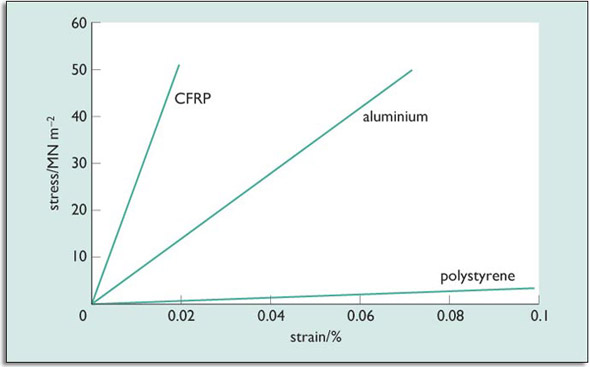
So, for example, if we look at the line for CFRP, we can calculate its stiffness by taking the slope of the graph.
The graph is a straight line, and starts at zero. At a stress of 40 MN m−2the strain is 0.015% for the CFRP.
The slope E is therefore given by:
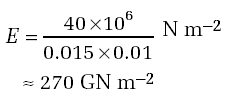
(Note the need to convert the strain from per cent to its absolute value.)
So the Young's modulus E of carbon fibre-reinforced polymer is around 270 GN m−2.
SAQ 18
Using the method just presented, calculate the Young's modulus of aluminium from Figure 56.
Answer
From Figure 55, at a stress of 40 MNm−2the strain is around 0.06 per cent for the aluminium. The slope E is therefore given by:
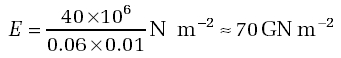
So the Young's modulus of aluminium is around 70 GN m−2.
These linear graphs show the behaviour of the materials at quite low stresses only. When the stresses are high enough, particularly for metals, the lines shown in Figure 56 can begin to curve (Figure 57). If this happens, then the material may be permanently deformed. That is, when the load is removed, the material does not return to its original shape or size. The material has not failed, in the sense that it has not fractured, but the stress has changed its shape. This is what happens when you bend a paperclip.
The capacity of materials to deform permanently is what enables manufacturers to press sheet metal to shape to create, for example, car body panels; but it can be a problem if a structural member may be subject to high stresses in use.
Some types of material do not show the kind of behaviour shown in Figure 57. Ceramics, for instance, break when the stress is high enough, without first becoming susceptible to permanent deformation. Think about bending a piece of chalk.
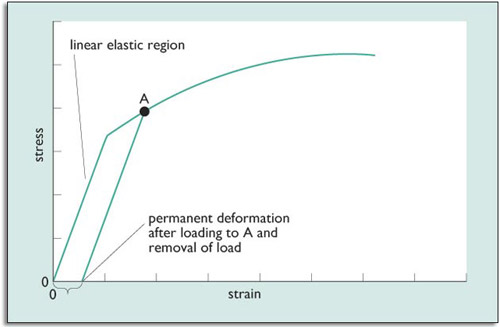
Figure 57: Stress–strain curve. If the material is stressed to point A, beyond the linear elastic region, removing the stress takes it down the line parallel to the original linear elastic region. Now when the material is unstressed it has a permanent deformation, or strain, as shown by the brace on the strain axis.
In the portion of the stress–strain graph where the curve is linear, the material is said to be operating in its linear region. When there are no permanent deformations the material is said to be in its elastic region. If both apply, the material is said to be operating in its linear–elastic region. This region is also sometimes referred to as Hookean, a term derived from the name of Robert Hooke, the physicist who first noted this linearity in elastic behaviour,
Not all materials have this useful, linear portion of the stress–strain curve. Rubber for example is non-linear over the whole of its stress–strain curve. Fortunately a surprising number of useful materials show an extensive linear region, which makes their behaviour relatively easy to understand and model mathematically.
Structural materials are used at sufficiently low stresses to ensure that they suffer no permanent deformations during use. It would be most disturbing if one's bicycle wasn't the same shape after the ride to work. In general a material designed for stiffness will be sufficiently strong not to fracture under normal use, although common experience leads us to observe that metals can fracture after repeated use (see Metal fatigue).
A steel object loaded to two thirds of the stress which would cause it to deform permanently during normal operation would be considered to be highly loaded. Such a figure provides ‘headroom’ of one third before something undesirable happens to the material, a safety factor of about 1.5. We are now encouraged to describe a safety factor as a ‘reserve factor on load’, though you might still prefer to call it a safety factor.
A bicycle designer wants the frame to be stiff, so needs materials with a high Young's modulus. The frame should also be light. We use density, σ, a material property, to give us a way of comparing different materials, in terms of their mass for a fixed volume. Simply comparing the Young's moduli and densities of different metals might not be very helpful because it would be a comparison of properties in isolation. What we need is a method of comparison that takes into account both density and Young's modulus. We need a Merit index.
Metal fatigue
Metal fatigue is an extremely common cause of material failure. Fatigue is a very subtle process, the onset of which can go unnoticed until the fatigued component fails. Fatigue can occur at stresses much below the strength of the material, so may cause failure in a condition that was considered safe by a designer.
Fatigue occurs when the stress in a component oscillates with time. If the oscillations are sufficiently great, they can lead to the initiation and growth of cracks within the material. These cracks can grow until the component fails, often quite catastrophically.
The existence of fatigue has been recognised for over 100 years, but it is only in recent decades that the process has been understood thoroughly to the point where it can be designed against successfully. Failures such as the Markham colliery disaster in 1973, the Hatfield rail crash in 2000, and the loss of three Comet airliners in the 1950s were caused by fatigue. The lessons learnt in each case mean that designers are progressively better equipped to prevent it occurring in future.
Merit index
A merit index is a combination of certain properties of a material that can be used to inform a process of materials selection for a particular set of criteria. The properties involved will depend on the application. For the bicycle frame discussed here, we are looking for a merit index to find a frame with the best stiffness at lowest weight.
We might also be interested, for the frame, in cost and corrosion resistance, but a merit index will only address one attribute at a time.
In the case of the bicycle, we want to have a high value of E, the Young's modulus, and a low value of σ, the density. A simple way of producing a merit index is to divide E by σ: this will give a number which becomes larger as E increases and also larger as σ decreases.
You will not have to derive merit indices yourself in this course; you will be taught examples of how to use them, though.
A ratio of E/σ produces a merit index for bars under tension. A high value of Young's modulus and a low density gives a very high merit index (and, of course, the higher the merit index the better). Doubling the Young's modulus whilst also doubling the density would leave the merit index unaltered.
SAQ 19
Table 3 gives data for three metals: aluminium, steel and titanium. For each of these, calculate the merit index of E/σ.
Answer
The bottom row of Table 4 gives the merit index for each material.
Table 4
| Aluminium | Steel | Titanium | |
| Density σ/kg m−3 | 2800 | 7900 | 4500 |
| Young's modulus E/GN m−2 | 70 | 210 | 110 |
| Merit index (E÷σ)/MN m kg−1 | 25 | 27 | 24 |
Note that the units for the merit index are rather peculiar. They are dependent on the criterion which has been selected for the merit index.
The answer to SAQ 19 shows that there isn't much to choose between them. Steel's merit index is slightly better than aluminium's and the titanium's is slightly worse. We have to be careful not to extend this analysis beyond its relevance. Remember that this is an analysis of a bar in tension for stiffness. It says nothing about strength.
SAQ 20
We saw in Section 6.6 that the strength of a material is the maximum stress that the material can withstand before it fails. Use the data in Table 5 to calculate a merit index for the strength-to-density ratio, σ f/σ, for the three metals. I am using the symbol σ fto represent the stress which causes the material to fail, that is, the material's strength.
Answer
The bottom row of Table 6 gives the merit index for strength.
The titanium used for Table 5 is the simplest form of alloy. Titanium alloys can achieve much higher values of strength but are difficult to manufacture. The steel used is one that can easily be drawn into tubes, and the aluminium is a common alloy that is relatively easy to weld.
The answer to SAQ 20 indicates that for strength-to-density aluminium shows some advantage, and indeed both aluminium and steel bicycles are available in the shops. One might, however, expect more aluminium bicycles to be available. The reasons that steel is more common are complex, involving cost and ease of manufacture.
Returning to the Brompton, in this case the main structural member of the design is a thin-walled tube acting as a beam – not simply being pulled in tension.
The derivation of merit indices for a beam is quite subtle. It turns out that the merit indices used for a bar (as given above) are appropriate for a beam made from a thin-walled tube only if the radius and weight of the tube are fixed. This clearly is not helpful; we want to have scope for changing the tube radius if it will help. If the radius is allowed to vary, an appropriate index for thin-walled tube of a given weight of material is E/σ3.
Exercise 11
Calculate the merit indices for stiffness of steel, aluminium and titanium based on this new merit index, E/σ3.
If the designer is not constrained by existing dimensions, aluminium starts to show a clear advantage. Early designers with aluminium used the same diameter tube as was used for steel bicycles for their aluminium bicycles so that clips and fittings from the existing market could be used. They were not using the material to its best advantage; more modern designs can be seen using very wide tube.
Merit indices, such as used here, are only part of the story. There are many factors to take into account. Clearly for a designer such as Andrew Ritchie general considerations were of little use. For example, he was designing a bicycle and didn't own a factory. His earliest influence was the Bickerton, which he criticised for being easy to knock about. It is true that because aluminium has a lower strength than steel, it dents more easily. Furthermore, we might expect slenderness to be an advantage for a folding bicycle, and steel is optimised for lower tube thicknesses than aluminium. Steel is ubiquitous for very good reasons.
Finally, before we return to the Brompton story, it is worth thinking a little more closely about the use of symbols, such as F,σ, E and so on, which have featured frequently in the foregoing material. See What's in a symbol?.
What's in a symbol?
When we use a symbol for a physical quantity, such as E for Young's modulus, what does the symbol actually represent?
A symbol such as E represents something more than just a number. Because we are using it as a shorthand for a property (Young's modulus), it must have a unit also. In the case of Young's modulus, the unit is N m−2; so E must represent this unit also. This means that when we assign a value to E, we do so by giving the symbol E both a number and a unit. You can think of this value as being a number multiplied by the unit. For example, the equation
is understood as meaning that E has a value of 9248 × (1 N m−2). Thus it would not be correct to say that Young's modulus was represented by E N m−2, because that would only make sense if E stood for a numerical term alone, such as 9248.
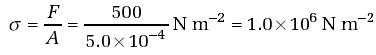
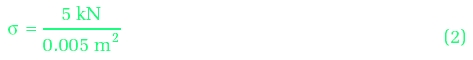
One consequence of this approach relates to the way calculations involving physical quantities are laid out in formal working. Take a calculation involving stress, for instance, which is defined as force divided by cross-sectional area over which the force acts (i.e. σ= F/A). Suppose we have a force F of 5000 N acting over an area A of 0.005 m2. We can calculate the stress as follows.
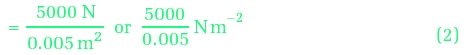

There are two points to notice here. First, when numerical values are substituted for F and A in line 2, the unit is included, because each of F and A represents the product of a number and a unit. Second, the symbol σ is always equated either to other symbols, as in line 1, or to a product of a number and a unit, as in lines 2 and 3. (Line 2 looks more complicated, but boils down to the product of a number and a unit as the line 3 shows.) Note that in the above example, the correct unit for the answer emerges naturally from the calculation and from the initial data.
The following is not acceptable in formal working.


Here the term in line 2a is just a numerical term with no unit, so it cannot be equated to x; and in line 3a the unit appears from nowhere. This is rather sloppy, and difficult to follow. It could also to lead to errors. For instance, if the force had originally been stated as 5 kN, it would have been essential to remember to convert it to 5000 N for line 2a. But if the unit is included, as earlier in line 2, it does not matter whether 5000 N or 5 kN is used in the calculation. Either will give a correct answer. That is, line 2 could have been written as:
Now the answer comes out as 103kN m−2, which is still correct.
Consider again the equation
If we divide both sides of this equation by ‘N m−2’, we get:
The right-hand side of this equation is now legitimately just a number, with no unit. This procedure of ‘dividing by the unit’ accounts for the style of labelling used for graph axes and tables of data. See for example Figure 54 or Table 4. The divisions on a graph axis, or the entries in a table, are regarded as pure numbers, so the labelling on the graph shows a physical term divided by the appropriate unit.
Fortunately you do not need to memorise or understand the details of the theory behind these conventions of notation. You can just think of the oblique slash as introducing the unit.