2 What do we know about recent climate change?
2.6 An evolving consensus on attribution
The fact that the Earth really is warming up now commands near-universal support. However, it is one thing to detect a global warming trend that appears to be unprecedented in the past millennium (Subsection 2.2.2), and quite another to establish with a given level of confidence that it has been caused by (i.e. can be attributed to) human activity – specifically, the increase in greenhouse gas concentrations and associated radiative forcing since pre-industrial times (reviewed in Section 1.6). Establishing ‘cause-and-effect’ relationships in the behaviour of complex natural systems is always difficult, and often controversial. With such high stakes in the present context, the ‘question of attribution’ is probably the most sensitive area of the IPCC's remit. Certainly, it is an area where the Panel has always exercised particular caution over its pronouncements, well aware that these will make headline news around the world. As scientists involved in the IPCC process have put it (Allen et al., 2001):
We should recall that the IPCC was under considerable pressure in 1990 to make a statement attributing observed climate changes to human influence ‘because if they don't, someone else will’ (and indeed, did). The IPCC is a cautious body, and if the evidence is not available in the peer-reviewed literature to support a statement, it will not make it, no matter how great the interest in that statement might be. In the end, this caution resulted in the attribution statement made in the Second Assessment Report [in 1996] having much more impact than if it had been made prematurely.
The reference here is to the much-quoted statement: ‘The balance of evidence suggests that there is a discernible human influence on global climate’. Even this decidedly equivocal language was sufficient to trigger charges that the IPCC process had been ‘corrupted’, and a high-profile campaign (again, especially in the US) aimed at discrediting the Panel's conclusions. Just five years later, however, the TAR pointed to humans as the culprits in more robust terms: it is ‘likely’ (66–90% probability; Box 8) that ‘most of the warming over the last 50 years’ is attributable to ‘the increase in greenhouse gas concentrations’ – the final bullet point at the beginning of this section.
Before we take a closer look at the evidence behind this statement, it is worth pausing to consider why there might be grounds for scepticism about there being a causal link between 20th century climate change and human activity – a stance that a few scientists continue to maintain. With this in mind, try Question 11 before moving on.
Question 11
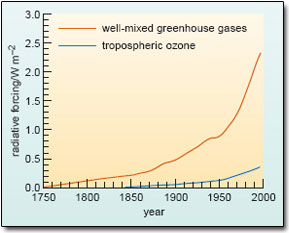
Figure 35: Time evolution of the radiative forcing during the industrial age, due to rising levels of well-mixed greenhouse gases (CO2, CH4, N2O and halocarbons) and tropospheric ozone.
- (a) Figure 36 shows how the greenhouse forcing of climate (summarised in Table 2, Section 1.6) has evolved over time since 1750. Compare the pattern of change in this figure with that marked out by the smoothed curve in the instrumental record of the Earth's GMST, Figure 24a. Why might this comparison raise doubts about attributing the development of global warming to the build up of greenhouse gases in the atmosphere?
- (b) What other sources of radiative forcing, both natural and anthropogenic, could also have influenced global temperature over the past century? In each case, indicate whether the forcing would be positive or negative, or whether it could act either way.
Answer
- (a) As noted in Subsection 2.2.2, the smoothed curve in the instrumental record (Figure 3.3a) traces a very irregular pattern of warming during the course of the 20th century. There is little direct correlation with the observed build up of greenhouse gases, which translates into a relatively smooth and accelerating increase in radiative forcing since pre-industrial times (Figure 35). In this context, the most striking inconsistency is the pause in the upward trend in GMST (or even a slight cooling; Activity 2) from the mid-1940s to the mid1970s – whereas the greenhouse forcing shows the steepest increase from around 1950.
- (b) Natural sources of radiative forcing include possible variations in the solarconstant during the 20th century (could be either positive or negative forcing), together with the short-term negative forcing associated with volcanic activity. Other anthropogenic factors include: the cooling effects (both direct and indirect) of sulfates and most carbonaceous aerosols; the warming effects of ‘black carbon’ (Section 1.6); and the effect on surface albedo of widespread deforestation (likely to be negative forcing; Question 5b).
[The important general point is that variations in the Earth's GMST reflect the influence of the total radiative forcing of climate, and how this has evolved over time during the past century: deviations from the ‘expected’ steady warming trend due to greenhouse forcing alone are only to be expected. Keep this in mind as you work through the rest of Section 2.6.]
2.6.1 Weighing up the evidence: the full cast of suspects
Figure 36 (again adapted from the TAR) takes your thoughts on Question 11 on a stage. It gives estimates of the cumulative effect since pre-industrial times of the various climate change agents, with the contributions expressed in terms of radiative forcing. Note that the figure also includes yet another device for communicating the IPCC's confidence in a particular finding – an indication of the ‘level of scientific understanding’ that accompanies each estimate. This reflects the authors' subjective judgement about the reliability of the forcing estimate, based on what is known about the factors that determine the forcing, the assumptions involved, and so on. Of the anthropogenic factors included in Figure 36, it is not surprising that there are large uncertainties, and generally very low confidence, in the estimates for various aerosols, given the difficulties touched on in Section 1.6. Clearly, this goes for the impact on surface albedo of historical changes in land use (e.g. deforestation; Question 5) as well. Only for the well-mixed greenhouse gases is confidence high.
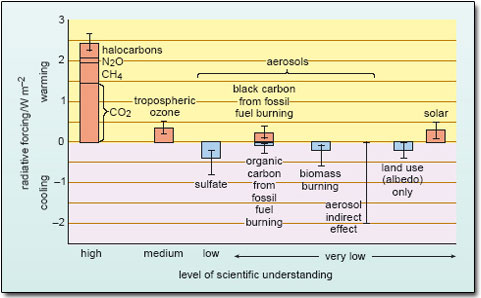
Figure 36: Estimated contributions to the radiative forcing of climate between 1750 and 2000, due to various anthropogenic factors (greenhouse gases, aerosols and land-use change) and to solar variability. Vertical lines represent subjective judgements of the uncertainty range in each estimate. They are not error bars (e.g. 95% confidence limits) in a conventional statistical sense. Note that it is not yet possible to give a ‘best guess’ estimate for the indirect cooling effect of aerosols (due to their influence on cloud albedo; Section 1.6). Note that ‘organic carbon’ refers to carbonaceous aerosols from fossil fuel burning, other than black carbon.
But what about the issue we flagged up earlier (Section 1.5) – the claim by some scientists that variations in the Sun's output (and hence the solar constant), and not higher levels of greenhouse gases, have been the main driving force behind 20th century global warming? This is a complicated and controversial area, and we do not have the space to go into it in any detail. However, it's important to be aware that the estimate of solar forcing included in Figure 36 is not based on direct measurements of variations in the solar constant. Such measurements became available only with the advent of satellite-borne radiation sensors in the late 1970s. These data reveal that the solar ‘constant’ does, in fact, vary slightly, fluctuating up and down (by about 0.08%) on an 11-year cycle. Unfortunately, the sensors degrade over time, and it is not yet clear whether these small rapid fluctuations (which are thought to have little effect on the Earth's climate) are superimposed on an underlying trend in the average value of the solar constant (given as 1368 W m−2 in Section 1.2.1) since the measurements began.
Reconstructions of what might have been happening to the solar constant further back in time rely on various proxy indicators of changes in solar activity (such as variations in the number of sunspots), and the relationship between such proxies and possible trends in the output of energy from the Sun (the key issue) is only poorly understood. Marked differences between the available reconstructions, together with uncertainties about the satellite record, account for the very low confidence in the ‘best guess’ estimate of historical solar forcing in Figure 36.
Given the information in Figure 36, why is it difficult to sustain an argument that the observed global warming is entirely due to solar variability?
Although solar variability appears to have made a positive contribution to climate forcing during the industrial age, the ‘best guess’ estimate is 0.3 W m−2 – only a small fraction of that contributed by the well-mixed greenhouse gases alone (2.4 W m−2); i.e. not counting the additional contribution from tropospheric ozone. It is inconsistent to argue that the Earth's GMST has been highly sensitive to very modest radiative forcing by the Sun, yet unaffected by substantial greenhouse forcing.
In short, the estimates in Figure 36 strongly implicate the chief ‘suspect’ for recent global warming – the enhanced greenhouse effect. But that does not, by itself, explain the bumpy rise in global temperature evident in Figure 24a, especially the puzzling pause in the upward trend in the middle of the 20th century (identified as a major inconsistency in Question 11). To address this issue, the starting point is a set of ‘forcing histories’ (i.e. reconstructions of the time-evolving change in radiative forcing like that in Figure 35) – one for each of the natural and anthropogenic factors that could have influenced global climate over the past century or so.
Since the aim is to construct a history of the total radiative forcing of climate, what other natural factor needs to be included in the analysis?
It should also include the history of volcanic forcing; i.e. the significant, though episodic and transient, negative forcing (cooling effect) from major volcanic eruptions.
In fact, volcanic activity was particularly strong at the end of the 19th century (e.g. the Krakatau eruption in 1883), and again since 1963 (culminating in the Pinatubo eruption in 1991; Figure 14, Section 1.5). By contrast, the first half of the 20th century was a quiet period for the major events that inject large amounts of volcanic aerosol into the stratosphere.
Look back at Figure 24a. Does the influence of the Pinatubo eruption show up in that record?
The annual values do indeed show a downturn in GMST in the years following this eruption (especially 1992 and 1993), so it is tempting to answer with a resounding ‘yes’.
Here, detailed analysis has confirmed this conclusion. In general, though, we should again be wary of jumping to conclusions. When it comes to the detailed interpretation of the Earth's recent temperature history, we need to be mindful of the influence of yet another natural factor. Even in the absence of an external ‘push’ provided by radiative forcing, the GMST would not remain constant year after year. Interactions within the climate system generate spontaneous, and inherently unpredictable, fluctuations in global temperature on a variety of time-scales, especially from year-to-year and over periods of a decade or so. This internally generated natural variability is a major source of the ‘background noise’ we referred to earlier (Section 2.2.2), and will always be superimposed on the global temperature response to any particular pattern of radiative forcing.
So, how do climate scientists assess in a quantitative way how the GMST might have responded to the history of radiative forcing over the past century – and thus gain a deeper insight into the underlying causes of the observed temperature changes? This is where climate modelling studies come into the picture.
2.6.2 The role of modelling studies
State-of-the-art models are designed to simulate the workings of the climate system (in so far as this is currently understood), and include the ‘internal’ interactions that generate short-term natural variability in the real world. They provide modellers with a means of carrying out ‘virtual’ experiments on the climate system. In the present context, an important aim of these experiments is to identify the ‘signal’ of a human influence on climate, so studies typically involve ‘feeding’ into a model the time-evolving history of radiative forcing due to:
- natural factors (solar variations and volcanic activity) alone;
- anthropogenic factors (usually just greenhouse gases and aerosols) alone; and
- both natural and anthropogenic factors combined.
In each case, the model simulates the time-evolving change in GMST in response to that particular history of radiative forcing, and this is then compared with the observed temperature record (i.e. Figure 24a). The results of modelling studies of this kind reported in the IPCC TAR are shown in Figure 37. Study the figure and its caption carefully, and then work through the following questions.
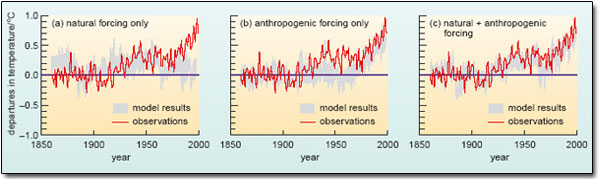
Figure 37: Complex climate models have been used to simulate the Earth's temperature variations over the past 140 years in response to both natural and anthropogenic forcings. The figure shows comparisons between the observed changes and the results of model simulations done with: (a) natural forcing (solar variations and volcanic activity) only; (b) anthropogenic forcing (greenhouse gases and sulfate aerosols) only; and (c) both combined. In each case, the grey band encompasses the results of several model runs and gives an idea of the uncertainty in the simulated response (including that in the ‘internal’ variability generated by the model). The simulations in (b) and (c) include estimates of the direct and indirect effects of sulfate aerosols. Note that temperature changes are given relative to (i.e. as ‘departures from’) the climatological average for 1880–1920, not 1961–1990 as in Figure 24a. (Source: IPCC, 2001d.)
What does the comparison in Figure 34a suggest about the influence of natural forcings during the course of the 20th century?
The net effect of solar variations and volcanic activity seems to have produced a positive forcing of climate during the first half of the century, and probably contributed to the observed warming at that time. However, natural factors alone would have resulted in a slight cooling of the planet thereafter (i.e. the net forcing was negative).
In other words, natural factors cannot explain the observed warming over the last 50 years.
How does the comparison in Figure 34b support the IPCC's conclusion that most of this warming was due to human activities?
The model-simulated response to anthropogenic forcing shows a persistent upward trend in GMST from around 1950 (when the greenhouse forcing accelerated; Figure 32). Further, the rate and magnitude of the simulated warming over recent decades is broadly consistent with the observed changes.
Note that the ‘compensating’ cooling effect (both direct and indirect) of the tropospheric load of sulfate aerosols, which increased throughout this period, is included in the study in Figure 37b. In experiments done with greenhouse forcing alone, the simulated warming over recent decades is typically larger than that observed in the real world.
Finally, Figure 37c shows that the best match with observations over the whole century is obtained in simulations that include both natural and anthropogenic forcings. This suggests that these forcings are sufficient to explain the major features of the Earth's recent temperature history. And that, in turn, adds weight to the case for an identifiable greenhouse warming signal over the past 50 years. The inconsistencies noted earlier (Question 11) then come down to the way this warming effect has been offset to some extent by the cooling influence of natural factors (especially around the middle of the century, evident in Figure 37a) and sulfate aerosols, together with the noise of internally generated natural variability.
Still, a word of caution is in order. For example, the simulations in Figure 37 do not include the influence of non-sulfate aerosols or past land-use changes. Bear in mind too the considerable uncertainty about the natural and anthropogenic forcings that are included – for all bar the contribution from increased greenhouse gas concentrations (Figure 36). Equally, it is pertinent to ask probing questions about the climate models used in studies like this (as we shall in Chapter 6: how confident should we be about the simulated response to radiative forcing?
The IPCC is well aware of these concerns – a major reason for caution over its pronouncements on the attribution question. The relevant chapter in the TAR documents the sophisticated statistical techniques that have been brought to bear on the significance of the similarities (or indeed, differences) between model simulated and observed changes – not only in the GMST, but also in other climate variables around the world (e.g. those included in Table 4). According to the IPCC, these more detailed studies ‘consistently find evidence for an anthropogenic signal in the climate record of the last 35 to 50 years’, even when uncertainties of the kind noted above are taken into account. Put this together with a longer and more closely scrutinised temperature record (Question 8), and the unprecedented warmth of recent decades (Section 2.2.2), and you can begin to see why the Panel finally felt able to endorse a less equivocal attribution statement. In the words that appeared in countless press reports when the TAR came out in 2001 (taken from one of the headings in the SPM): ‘There is new and stronger evidence that most of the warming observed over the last 50 years is attributable to human activities’.
The IPCC is not alone in its conclusions. As one recent article in the journal Science put it (Oreskes, 2004):
In recent years, all major scientific bodies in the United States whose members’ expertise bears directly on the matter have issued similar statements […] concluding that the evidence for human modification of climate is compelling.
In short, the overwhelming scientific consensus is that the human impact on the atmospheric burden of greenhouse gases has made a significant contribution to recent climate warming – and hence, by implication, to the observed changes in other climate variables, and in physical and biological systems reviewed in Section 2.5. But what of the future? What further climate changes might lie ahead in a future that could see an extra three billion people on the planet by 2050 (Figure 18, Section 1.6)?
Just as simulations with climate models have provided insight into the human influence on climate in the past, so they are fundamental to projections of future human-induced climate change. A climate model is just what the name implies: a ‘model’ of the ‘climate system’. But what do we actually mean by the Earth's climate system? This question has been lurking in the background in this and earlier sections and needs to be addressed, but is beyond the scope of this unt.